Statistiques de base
| Propriétaires institutionnels | 122 total, 117 long only, 1 short only, 4 long/short - change of -11,24% MRQ |
| Allocation moyenne du portefeuille | 0.4462 % - change of 26,61% MRQ |
| Actions institutionnelles (Long) | 5 222 957 (ex 13D/G) - change of -1,31MM shares -11,13% MRQ |
| Valeur institutionnelle (Long) | $ 360 689 USD ($1000) |
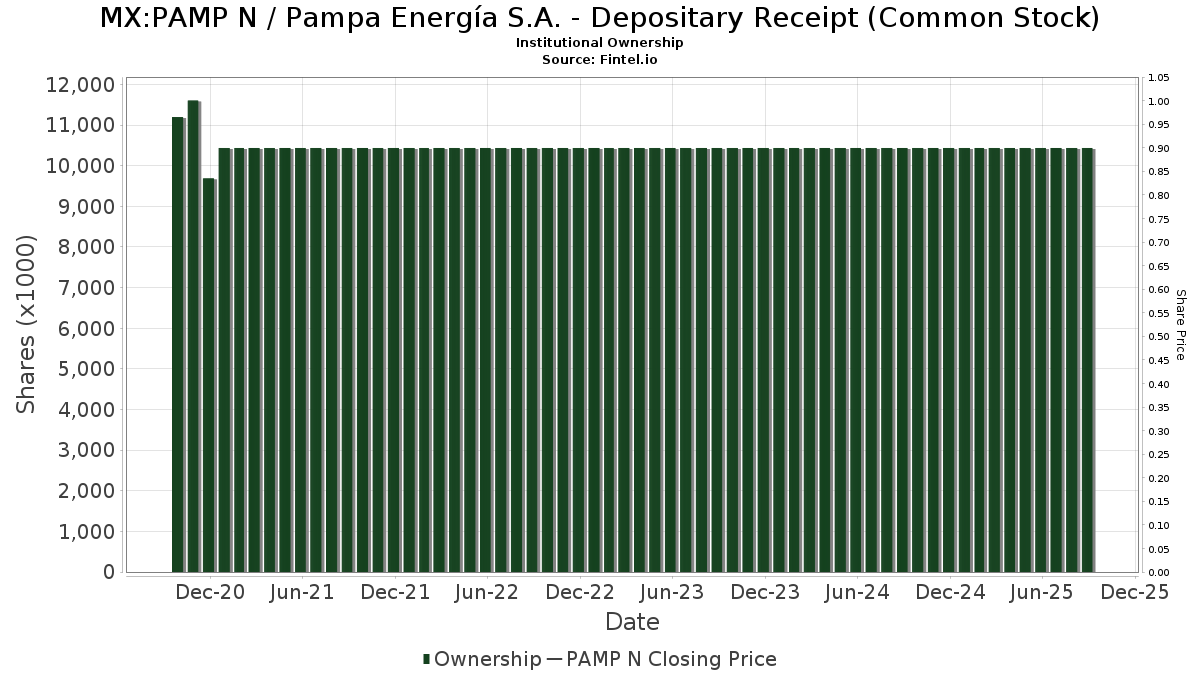
Participation institutionnels et actionnaires
Pampa Energía S.A. - Depositary Receipt (Common Stock) (MX:PAMP N) détient 122 des propriétaires institutionnels et des actionnaires qui ont déposé des formulaires 13D/G ou 13F auprès de la Securities Exchange Commission (SEC). Ces institutions détiennent un total de 5,223,555 actions. Les principaux actionnaires incluent TT International Asset Management LTD, MIRAE ASSET GLOBAL ETFS HOLDINGS Ltd., ARGT - Global X MSCI Argentina ETF, Helikon Investments Ltd, Millennium Management Llc, Jpmorgan Chase & Co, Itau Unibanco Holding S.A., VR Advisory Services Ltd, Morgan Stanley, and Voloridge Investment Management, Llc .
Pampa Energía S.A. - Depositary Receipt (Common Stock) (BMV:PAMP N) la structure de l'actionnariat institutionnel indique les positions actuelles des institutions et des fonds dans l'entreprise, ainsi que les derniers changements dans le volume des positions. Les principaux actionnaires peuvent être des investisseurs individuels, des fonds communs de placement, des fonds spéculatifs ou des institutions. L'annexe 13D indique que l'investisseur détient (ou a détenu) plus de 5 % de l'entreprise et qu'il a l'intention (ou a eu l'intention) de poursuivre activement un changement de stratégie commerciale. L'annexe 13G indique un investissement passif de plus de 5 %.
Indice de confiance des fonds
L'indice de confiance des fonds (anciennement score d'accumulation de participation) trouve les actions qui sont les plus achetées par les fonds. Il est le résultat d'un modèle quantitatif sophistiqué à plusieurs facteurs qui identifie les entreprises avec les niveaux les plus élevés d'accumulation institutionnelle. Le modèle de notation utilise une combinaison de l'augmentation totale des propriétaires déclarés, des variations des allocations de portefeuille chez ces propriétaires et d'autres indicateurs. Le chiffre varie de 0 à 100, les chiffres plus élevés indiquant un niveau d'accumulation plus élevé par rapport aux autres entreprises, 50 étant la moyenne.
Fréquence de mise à jour : Quotidienne
Déclarations 13F et NPORT
Les détails des déclarations 13F sont gratuits. Les détails des déclarations NP nécessitent une adhésion premium. Les lignes vertes indiquent de nouvelles positions. Les lignes rouges indiquent des positions clôturées. Cliquez sur l'icône du lien pour voir l'historique complet des transactions.
Mettre à niveau
pour débloquer des données premium et les exporter vers Excel ![]() .
.
| Date de dépôt | Source | Investisseur | Type | Prix moyen (Est) |
Actions | Δ Actions (%) |
Valeur déclarée (1000 $) |
Δ Valeur (%) |
Allocation de portefeuille (%) |
|
|---|---|---|---|---|---|---|---|---|---|---|
| 2025-05-30 | NP | Highland Global Allocation Fund | 67 700 | 0,00 | 5 226 | -12,21 | ||||
| 2025-07-25 | 13F | Cwm, Llc | 51 | 0,00 | 0 | |||||
| 2025-08-26 | NP | DRESX - Driehaus Emerging Markets Small Cap Growth Fund | 21 253 | 17,44 | 1 475 | 5,51 | ||||
| 2025-08-13 | 13F | Townsquare Capital Llc | 0 | -100,00 | 0 | |||||
| 2025-08-14 | 13F | D. E. Shaw & Co., Inc. | 3 168 | -23,20 | 220 | -31,13 | ||||
| 2025-05-14 | 13F | First Trust Advisors Lp | 0 | -100,00 | 0 | |||||
| 2025-08-11 | 13F | Principal Securities, Inc. | 11 | 1 | ||||||
| 2025-04-17 | 13F | Qrg Capital Management, Inc. | 0 | -100,00 | 0 | |||||
| 2025-05-09 | 13F | Headlands Technologies LLC | 0 | -100,00 | 0 | |||||
| 2025-07-30 | 13F | Financial Perspectives, Inc | 114 | 0,00 | 8 | -12,50 | ||||
| 2025-07-29 | 13F | William Blair Investment Management, Llc | 89 640 | 6,47 | 6 219 | -4,31 | ||||
| 2025-07-29 | 13F | Beverly Hills Private Wealth, LLC | 3 731 | -6,89 | 259 | -16,50 | ||||
| 2025-06-24 | NP | JEMA - JPMorgan Emerging Markets Equity Core ETF | 0 | -100,00 | 0 | -100,00 | ||||
| 2025-08-06 | 13F | Titan Global Capital Management Usa Llc | 9 275 | -7,27 | 643 | -16,71 | ||||
| 2025-08-14 | 13F | Driehaus Capital Management Llc | 21 253 | 17,44 | 1 475 | 5,51 | ||||
| 2025-05-14 | 13F | Candriam Luxembourg S.C.A. | 0 | -100,00 | 0 | |||||
| 2025-08-25 | NP | AADR - AdvisorShares Dorsey Wright ADR ETF | 20 740 | 19,95 | 1 439 | 7,80 | ||||
| 2025-05-16 | 13F | Arete Wealth Advisors, LLC | 0 | -100,00 | 0 | |||||
| 2025-08-13 | 13F | Centiva Capital, LP | 3 331 | 231 | ||||||
| 2025-06-02 | 13F/A | Deutsche Bank Ag\ | 0 | -100,00 | 0 | |||||
| 2025-08-04 | 13F | AdvisorShares Investments LLC | 20 740 | 19,95 | 1 439 | 5,66 | ||||
| 2025-08-14 | 13F | Jane Street Group, Llc | 17 665 | -9,90 | 1 226 | -19,04 | ||||
| 2025-08-14 | 13F | Bnp Paribas Arbitrage, Sa | 12 382 | -82,70 | 859 | -84,45 | ||||
| 2025-05-08 | NP | QGBLX - Quantified Global Fund Investor Class | 730 | 158,87 | 56 | 133,33 | ||||
| 2025-08-14 | 13F | Cubist Systematic Strategies, LLC | 58 577 | 30,69 | 4 064 | 17,46 | ||||
| 2025-08-04 | 13F | Yorktown Management & Research Co Inc | 12 900 | 0,00 | 895 | -10,05 | ||||
| 2025-07-14 | 13F | Toth Financial Advisory Corp | 100 | 0,00 | 7 | -14,29 | ||||
| 2025-08-14 | 13F | Qube Research & Technologies Ltd | 5 456 | 379 | ||||||
| 2025-07-18 | 13F | Deltec Asset Management Llc | 3 000 | 0,00 | 208 | -9,96 | ||||
| 2025-08-08 | 13F | Pnc Financial Services Group, Inc. | 10 | 25,00 | 1 | |||||
| 2025-07-24 | 13F | Ronald Blue Trust, Inc. | 6 | -94,92 | 0 | -100,00 | ||||
| 2025-08-12 | 13F | EAM Global Investors LLC | 0 | -100,00 | 0 | |||||
| 2025-08-25 | NP | EITEX - Parametric Tax-Managed Emerging Markets Fund Institutional Class | 6 575 | 0,00 | 456 | -10,06 | ||||
| 2025-08-01 | 13F | Banco Santander, S.A. | 4 248 | 48,12 | 295 | 33,03 | ||||
| 2025-08-13 | 13F | Quantbot Technologies LP | 0 | -100,00 | 0 | |||||
| 2025-08-27 | NP | IEMSX - ABS Insights Emerging Markets Fund Super Institutional Class Shares | 3 300 | 0,00 | 229 | -10,24 | ||||
| 2025-08-27 | NP | TIFF INVESTMENT PROGRAM - TIFF Multi-Asset Fund | Short | -598 | -41 | |||||
| 2025-05-15 | 13F | Compass Group Llc | 0 | -100,00 | 0 | |||||
| 2025-08-11 | 13F | Fore Capital, LLC | 3 000 | 208 | ||||||
| 2025-08-14 | 13F | Bank Of America Corp /de/ | 17 279 | -32,97 | 1 199 | -39,77 | ||||
| 2025-08-14 | 13F | Susquehanna International Group, Llp | Put | 10 300 | -45,50 | 715 | -51,06 | |||
| 2025-08-14 | 13F | Susquehanna International Group, Llp | 11 755 | -37,17 | 816 | -43,56 | ||||
| 2025-08-14 | 13F | Susquehanna International Group, Llp | Call | 26 100 | 64,15 | 1 811 | 47,51 | |||
| 2025-08-14 | 13F | Diversify Wealth Management, Llc | 23 221 | 14,41 | 1 767 | 18,36 | ||||
| 2025-08-08 | 13F | Alberta Investment Management Corp | 0 | -100,00 | 0 | |||||
| 2025-08-14 | 13F | Ameriprise Financial Inc | 0 | -100,00 | 0 | |||||
| 2025-07-14 | 13F | Ridgewood Investments LLC | 100 | 0,00 | 7 | -14,29 | ||||
| 2025-08-14 | 13F | Federation des caisses Desjardins du Quebec | 200 | 0,00 | 14 | -13,33 | ||||
| 2025-08-06 | 13F | First Horizon Advisors, Inc. | 742 | 51 | ||||||
| 2025-07-11 | 13F | Farther Finance Advisors, LLC | 184 | 0,00 | 13 | -14,29 | ||||
| 2025-08-20 | NP | WXCIX - William Blair Emerging Markets ex China Growth Fund Class I | 2 750 | -0,25 | 191 | -10,38 | ||||
| 2025-04-22 | 13F | Verde Servicos Internacionais S.A. | 0 | -100,00 | 0 | |||||
| 2025-07-21 | 13F | Ping Capital Management, Inc. | 76 200 | 74,90 | 5 287 | 57,18 | ||||
| 2025-08-14 | 13F | Sunbelt Securities, Inc. | 60 | 0,00 | 5 | 25,00 | ||||
| 2025-08-14 | 13F | Royal Bank Of Canada | 736 | -13,82 | 51 | -21,54 | ||||
| 2025-08-14 | 13F | Turim 21 Investimentos Ltda. | 10 916 | 0,00 | 757 | -10,10 | ||||
| 2025-05-16 | 13F | Jones Financial Companies Lllp | 0 | -100,00 | 0 | |||||
| 2025-06-27 | NP | ARGT - Global X MSCI Argentina ETF This fund is a listed as child fund of Mirae Asset Global Investments Co., Ltd. and if that institution has disclosed ownership in this security, then these positions will not be double counted when calculating total shares and total value | 552 302 | -6,26 | 39 208 | -25,59 | ||||
| 2025-08-08 | 13F | Wrapmanager Inc | 3 135 | -2,37 | 218 | -12,15 | ||||
| 2025-08-14 | 13F | Aquatic Capital Management LLC | 11 050 | -25,69 | 767 | -33,28 | ||||
| 2025-08-14 | 13F | Two Sigma Investments, Lp | 0 | -100,00 | 0 | |||||
| 2025-08-14 | 13F | Citadel Advisors Llc | Put | 16 600 | 0,00 | 1 152 | -10,15 | |||
| 2025-08-14 | 13F | LWM Advisory Services, LLC | 4 373 | -17,35 | 303 | -25,74 | ||||
| 2025-07-18 | 13F | Truist Financial Corp | 18 895 | 0,21 | 1 311 | -9,97 | ||||
| 2025-07-18 | 13F | PFG Investments, LLC | 4 275 | 297 | ||||||
| 2025-07-29 | 13F | Stratos Wealth Partners, LTD. | 0 | -100,00 | 0 | |||||
| 2025-08-14 | 13F | Citadel Advisors Llc | Call | 6 200 | -32,61 | 430 | -39,44 | |||
| 2025-08-14 | 13F/A | Barclays Plc | 380 | 0 | ||||||
| 2025-08-14 | 13F | Citadel Advisors Llc | 4 958 | -56,84 | 344 | -61,29 | ||||
| 2025-06-11 | NP | SLANX - DWS Latin America Equity Fund Class A | 25 521 | 35,79 | 1 812 | 7,80 | ||||
| 2025-08-12 | 13F | Insigneo Advisory Services, Llc | 10 186 | 15,03 | 707 | 3,37 | ||||
| 2025-05-15 | 13F | Hood River Capital Management LLC | 0 | -100,00 | 0 | |||||
| 2025-08-11 | 13F | Citigroup Inc | 349 | -22,44 | 24 | -29,41 | ||||
| 2025-08-11 | 13F | Absolute Gestao de Investimentos Ltda. | 41 547 | 2 883 | ||||||
| 2025-08-05 | 13F | Simplex Trading, Llc | Put | 300 | 0 | |||||
| 2025-07-22 | NP | IHIAX - Federated Emerging Market Debt Fund Class A Shares This fund is a listed as child fund of Federated Hermes, Inc. and if that institution has disclosed ownership in this security, then these positions will not be double counted when calculating total shares and total value | 183 | 14 | ||||||
| 2025-08-05 | 13F | Simplex Trading, Llc | Call | 200 | 100,00 | 0 | ||||
| 2025-06-27 | NP | EAEMX - Parametric Emerging Markets Fund Investor Class | 1 829 | 0,00 | 130 | -20,86 | ||||
| 2025-08-15 | 13F | Tower Research Capital LLC (TRC) | 66 | 5 | ||||||
| 2025-05-14 | 13F | Flow Traders U.s. Llc | 0 | -100,00 | 0 | |||||
| 2025-07-15 | 13F | Burns Matteson Capital Management, LLC | 3 414 | 41,60 | 237 | 26,88 | ||||
| 2025-07-22 | 13F | Gsa Capital Partners Llp | 3 615 | 0 | ||||||
| 2025-07-16 | 13F | ABS Direct Equity Fund LLC | 25 054 | -15,78 | 1 738 | -24,30 | ||||
| 2025-07-16 | 13F | ORG Wealth Partners, LLC | 84 | 0,00 | 6 | -16,67 | ||||
| 2025-08-27 | 13F/A | Squarepoint Ops LLC | 5 777 | 77,15 | 401 | 59,36 | ||||
| 2025-08-14 | 13F | Mml Investors Services, Llc | 14 156 | 1 | ||||||
| 2025-08-14 | 13F | Point72 Asset Management, L.P. | 22 200 | -72,42 | 1 540 | -75,21 | ||||
| 2025-05-15 | 13F | Oaktree Capital Management Lp | 0 | -100,00 | 0 | |||||
| 2025-09-04 | 13F/A | Advisor Group Holdings, Inc. | 3 413 | -1,67 | 237 | -11,61 | ||||
| 2025-08-08 | 13F | SBI Securities Co., Ltd. | 127 | 0,79 | 9 | -11,11 | ||||
| 2025-08-14 | 13F | D. E. Shaw & Co., Inc. | Call | 0 | -100,00 | 0 | ||||
| 2025-08-14 | 13F | Two Sigma Advisers, Lp | 3 000 | -69,39 | 208 | -72,49 | ||||
| 2025-08-14 | 13F | Goldman Sachs Group Inc | 11 176 | 53,77 | 775 | 38,15 | ||||
| 2025-08-14 | 13F | Voloridge Investment Management, Llc | 118 614 | -28,72 | 8 229 | -35,95 | ||||
| 2025-08-14 | 13F | GWM Advisors LLC | 287 | 0,00 | 20 | -13,64 | ||||
| 2025-05-14 | 13F | Jump Financial, LLC | 0 | -100,00 | 0 | |||||
| 2025-07-23 | 13F | Ameliora Wealth Management Ltd. | 0 | -100,00 | 0 | |||||
| 2025-08-12 | 13F | Jpmorgan Chase & Co | 317 998 | -9,49 | 22 063 | -18,66 | ||||
| 2025-08-14 | 13F | Verition Fund Management LLC | 19 036 | 1 321 | ||||||
| 2025-08-14 | 13F | Group One Trading, L.p. | Call | 0 | -100,00 | 0 | -100,00 | |||
| 2025-08-13 | 13F | Federated Hermes, Inc. | 8 337 | 578 | ||||||
| 2025-08-14 | 13F | Toroso Investments, LLC | 0 | -100,00 | 0 | |||||
| 2025-07-17 | 13F | Janney Montgomery Scott LLC | 8 170 | -0,01 | 1 | |||||
| 2025-08-13 | 13F | EverSource Wealth Advisors, LLC | 892 | -5,11 | 62 | -15,28 | ||||
| 2025-08-08 | 13F | Helikon Investments Ltd | 492 578 | 0,00 | 34 175 | -10,13 | ||||
| 2025-08-14 | 13F | Banco BTG Pactual S.A. | 93 583 | 467,17 | 6 493 | 409,98 | ||||
| 2025-08-14 | 13F | Stifel Financial Corp | 11 114 | -0,13 | 771 | -10,24 | ||||
| 2025-08-13 | 13F | Northern Trust Corp | 6 758 | 10,46 | 469 | -0,85 | ||||
| 2025-08-14 | 13F | Diversify Advisory Services, LLC | 7 172 | 23,25 | 546 | 27,63 | ||||
| 2025-08-13 | 13F | Marshall Wace, Llp | 57 153 | 21,71 | 3 965 | 9,38 | ||||
| 2025-08-14 | 13F | Brevan Howard Capital Management LP | 38 803 | 2 768 | ||||||
| 2025-08-11 | 13F | Dorsey Wright & Associates | 29 907 | -38,67 | 2 075 | -44,89 | ||||
| 2025-05-30 | NP | EHLS - Even Herd Long Short ETF | 2 819 | -42,40 | 218 | -49,53 | ||||
| 2025-05-15 | 13F | Old Mission Capital Llc | 0 | -100,00 | 0 | -100,00 | ||||
| 2025-08-14 | 13F | Raymond James Financial Inc | 532 | 37 | ||||||
| 2025-08-06 | 13F | Decker Retirement Planning Inc. | 2 | 0 | ||||||
| 2025-08-14 | 13F | Seldon Capital Lp | 0 | -100,00 | 0 | |||||
| 2025-08-14 | 13F | Glenorchy Capital Ltd | 70 039 | -2,09 | 4 859 | -12,01 | ||||
| 2025-08-04 | 13F | Spire Wealth Management | 42 | 0,00 | 3 | -33,33 | ||||
| 2025-08-12 | 13F | Rhumbline Advisers | 44 | 0,00 | 3 | 0,00 | ||||
| 2025-08-14 | 13F | Hrt Financial Lp | 4 422 | -4,41 | 0 | |||||
| 2025-05-15 | 13F | Two Sigma Securities, Llc | 0 | -100,00 | 0 | |||||
| 2025-08-12 | 13F | LPL Financial LLC | 15 082 | 124,43 | 1 046 | 101,93 | ||||
| 2025-08-14 | 13F | Integrated Wealth Concepts LLC | 4 807 | 334 | ||||||
| 2025-07-30 | 13F | Whittier Trust Co | 23 229 | 10,52 | 1 612 | -0,68 | ||||
| 2025-08-05 | 13F | Advisors Preferred, LLC | 0 | -100,00 | 0 | |||||
| 2025-07-14 | 13F | UMA Financial Services, Inc. | 1 | 0,00 | 0 | |||||
| 2025-05-14 | 13F | Credit Agricole S A | 920 | 0,00 | 71 | -11,25 | ||||
| 2025-08-13 | 13F | Pictet Asset Management Holding SA | 15 301 | 146,71 | 1 062 | 121,97 | ||||
| 2025-08-05 | 13F | Claro Advisors LLC | 0 | -100,00 | 0 | |||||
| 2025-08-14 | 13F | Group One Trading, L.p. | Put | 5 000 | 0,00 | 347 | -10,36 | |||
| 2025-08-14 | 13F | Balyasny Asset Management Llc | 103 216 | 11,57 | 7 161 | 0,27 | ||||
| 2025-08-14 | 13F | Millennium Management Llc | 359 769 | 121,37 | 24 961 | 98,95 | ||||
| 2025-07-10 | 13F | TT International Asset Management LTD | 1 102 407 | -16,46 | 76 485 | -24,92 | ||||
| 2025-08-13 | 13F | Hsbc Holdings Plc | 25 049 | -29,54 | 1 766 | -35,91 | ||||
| 2025-08-14 | 13F | Group One Trading, L.p. | 973 | 68 | ||||||
| 2025-08-14 | 13F | UBS Group AG | 34 293 | 88,23 | 2 379 | 69,20 | ||||
| 2025-07-21 | 13F | Mirae Asset Global Investments Co., Ltd. | 562 | 8,29 | 39 | -5,00 | ||||
| 2025-08-15 | 13F | Morgan Stanley | 142 268 | 18,87 | 9 871 | 6,83 | ||||
| 2025-08-14 | 13F | Wells Fargo & Company/mn | 167 | -71,45 | 12 | -75,56 | ||||
| 2025-08-19 | 13F | Marex Group plc | 20 885 | 1 449 | ||||||
| 2025-06-23 | NP | Global Macro Capital Opportunities Portfolio - Global Macro Capital Opportunities Portfolio | 54 869 | 0,92 | 3 895 | -19,89 | ||||
| 2025-05-13 | 13F | Wellington Management Group Llp | 0 | -100,00 | 0 | -100,00 | ||||
| 2025-08-12 | 13F | Proequities, Inc. | Put | 0 | 0 | |||||
| 2025-08-12 | 13F | Proequities, Inc. | Call | 0 | 0 | |||||
| 2025-08-12 | 13F | Proequities, Inc. | 0 | 0 | ||||||
| 2025-07-11 | 13F | Assenagon Asset Management S.A. | 0 | -100,00 | 0 | |||||
| 2025-08-01 | 13F | Envestnet Asset Management Inc | 30 306 | 18,17 | 2 103 | 6,22 | ||||
| 2025-05-15 | 13F | BTG Pactual Asset Management US LLC | 0 | -100,00 | 0 | |||||
| 2025-08-07 | 13F | Acadian Asset Management Llc | 7 969 | -47,15 | 1 | -100,00 | ||||
| 2025-08-14 | 13F | Barometer Capital Management Inc. | 5 900 | 31,11 | 409 | 17,87 | ||||
| 2025-06-30 | NP | APITX - Yorktown Growth Fund Class L Shares | 12 900 | 0,00 | 916 | -20,64 | ||||
| 2025-08-12 | 13F | Personal Cfo Solutions, Llc | 4 335 | 6,80 | 301 | -4,15 | ||||
| 2025-07-31 | 13F | Caitong International Asset Management Co., Ltd | 55 | 111,54 | 4 | 50,00 | ||||
| 2025-08-01 | 13F | Shilanski & Associates, Inc. | 4 253 | 0,07 | 295 | -10,06 | ||||
| 2025-05-15 | 13F | Discovery Capital Management, Llc / Ct | 0 | -100,00 | 0 | -100,00 | ||||
| 2025-07-08 | 13F | Northwest & Ethical Investments L.P. | 0 | -100,00 | 0 | -100,00 | ||||
| 2025-08-04 | 13F | Atria Investments Llc | 7 224 | 0,33 | 501 | -9,73 | ||||
| 2025-08-12 | 13F | Virtu Financial LLC | 0 | -100,00 | 0 | |||||
| 2025-07-14 | 13F | GAMMA Investing LLC | 2 134 | -7,70 | 148 | -16,85 | ||||
| 2025-06-23 | NP | UBPIX - Ultralatin America Profund Investor Class | 574 | -2,55 | 41 | -23,08 | ||||
| 2025-08-14 | 13F | Highland Capital Management Fund Advisors, L.p. | 0 | -100,00 | 0 | |||||
| 2025-07-30 | NP | APIE - ActivePassive International Equity ETF | 5 761 | -25,39 | 442 | -25,63 | ||||
| 2025-08-08 | 13F | Itau Unibanco Holding S.A. | 304 174 | 42,35 | 21 104 | 131 793,75 | ||||
| 2025-05-09 | 13F | R Squared Ltd | 0 | -100,00 | 0 | |||||
| 2025-07-30 | 13F | Whittier Trust Co Of Nevada Inc | 10 690 | 51,76 | 742 | 36,46 | ||||
| 2025-08-14 | 13F | Jain Global LLC | 0 | -100,00 | 0 | |||||
| 2025-08-14 | 13F | VR Advisory Services Ltd | 272 013 | 0,00 | 18 872 | -10,13 | ||||
| 2025-08-14 | 13F | MIRAE ASSET GLOBAL ETFS HOLDINGS Ltd. | 603 127 | 8,19 | 41 845 | -2,77 | ||||
| 2025-08-08 | 13F | Cetera Investment Advisers | 7 763 | -2,76 | 539 | -12,66 |